Selected results from previous surveys

The data of each survey is analyzed by the team of the Student Life Cycle Study and published in various ways. The results can be found in different publication formats of the DZHW, in presentations, journal articles or monographs.

Selected results from previous surveys

Paths after graduation

Paths after graduation

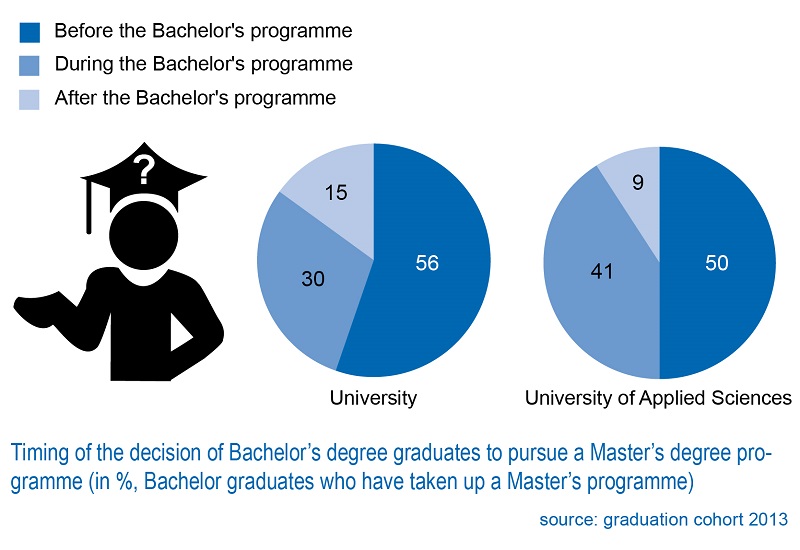
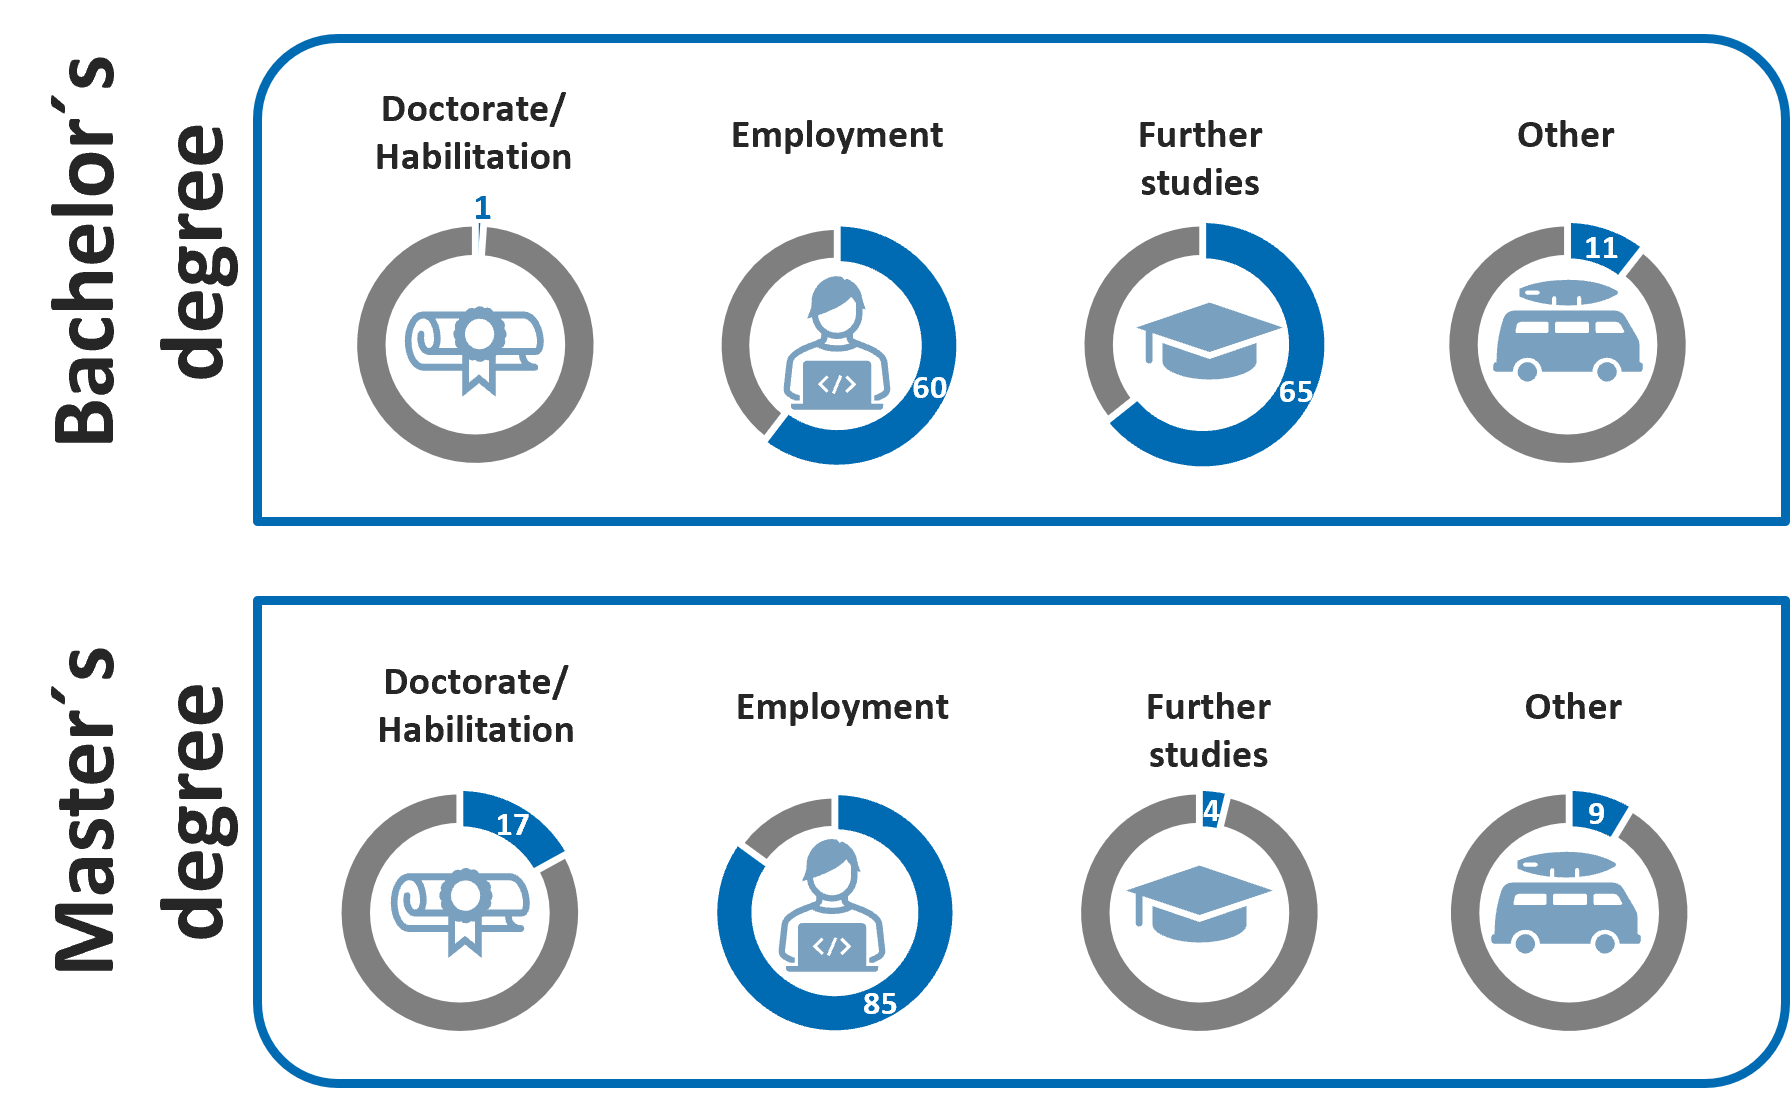
Upon graduation, university graduates are faced with the decision of whether to enter the job market or pursue further qualifications (master's degree, doctorate).

As expected, the type of employment after graduation varies greatly depending on the type of degree: While the majority of master's graduates (85 %) were already employed at the time of the survey (76 % in salaried employment and 9 % self-employed), the figure for bachelor's graduates was only 60 % (52 % in salaried employment and 8 % self-employed). For 47 % of employed bachelor's degree graduates, this employment also takes place parallel to their studies (MA: 3 %, not shown). At the time of the survey, 63 % of bachelor's degree graduates were enrolled in further studies; among master's degree graduates, the figure was only 4 %.

From the survey cohort 2021

Graduates of universities of applied sciences later decide to study a master's degree

Graduates of universities of applied sciences later decide to study a master's degree

Bachelor's graduates at universities show higher transition rates to Master’s programmes than graduates at universities of applied sciences. Particularly high transition rates to Master’s programmes at universities can be observed in the natural sciences, engineering sciences and teacher training programmes. But also in humanities and economics, three out of four graduates start a Master's programme after their Bachelor's degree.

About every second graduate of a Bachelor’s degree from a university with a subsequent Master's degree had already decided to later take up a Master programme before starting the first degree. Only a small group (9%) decided to study a Master's degree after graduating their Bachelor programme. In contrast, graduates with Bachelor’s degrees at universities of applied sciences usually only decide on a Master’s during their first degree or afterwards.

(source: examination cohort 2013)

Positive assessment of own career prospects

Positive assessment of own career prospects

62% of students in the 2022 cohort rate their own career prospects as very good or good. The downward trend of previous surveys is therefore not continuing for the time being. Compared to 2012, however, there is still a difference of 11 percentage points (73% in 2012). It is also evident that men rate their own career prospects more positively than women across all cohorts. In the 2022 cohort, 68% of men and only 58% of women describe their career prospects as very good or good.

(Survey of the 2022 cohort of students)

Gender differences in the choice of vocational training (VET)

Gender differences in the choice of vocational training (VET)

There are clear gender differences in the choice of VET occupations among graduates in the 2022 cohort: among female respondents, VET occupations in the healthcare and social professions are the most popular. 8 % of all female respondents in the surveyed cohort stated that they had started vocational training in this area or were definitely planning to do so. The proportion of male respondents indicating this was significantly lower at 3 %. The second most likely choice of VET occupations for females was in the office and commercial services sector (4 %), followed by occupations in goods trade and sales (2 %). For male respondents, on the other hand, the most frequently chosen training occupations were in production occupations and here primarily in the main occupational field of processing, manufacturing and repairing occupations (6 % vs. 1 % for female respondents), followed by occupations in the technical and scientific field.

(Survey of the 2022 cohort of school graduates)

Difficulties in decision-making

Difficulties in decision-making

Six months before leaving school, students in the 2018 cohort of school graduates were confronted with various problems when it came to choosing their post-school career. Pupils often found it particularly difficult to keep track of the number of options (45 %), access restrictions (43 %) and uncertainty about their own interests (42 %). Compared to the 2008 cohort, these proportions have increased significantly (2008: 37 %, 31 % and 26 % respectively). Less frequently, but still mentioned by around a quarter of school graduates, are the financing of studies/training (27 %) or the difficulty in obtaining helpful information (24 %).

(Survey of the 2018 cohort of school graduates)

Around four out of ten students feel well informed.

Around four out of ten students feel well informed.

Six months before leaving school, the majority of those with higher education entrance qualifications (93 %) had already begun to actively gather information about study and training opportunities. When planning their post-school careers, three out of four graduates feel supported by their parents. To a lesser extent, they perceive their friends to be supportive (37 %). 27 % of those with higher education entrance qualifications stated that they received a high level of support from study and careers advisors. This figure has risen by seven percentage points compared to the 2012 survey cohort (2012: 19 %; 2018: 26 %).

(Survey of the 2018 cohort of students)

Break after university entrance qualification

Break after university entrance qualification

Respondents who have not yet started a course of study, vocational training or a job six months after gaining their higher education entrance qualification most frequently cite wanting to take a break after school as the reason for the delay (45 %). In addition, the majority are still undecided about their future career (38 %). Voluntary services account for the largest proportion (35 %) of transitional activities: 23 % of those eligible to study complete a voluntary social or ecological year, a federal voluntary service (11 %) or voluntary military service (1 %). Jobbing (22 %), stays abroad (16 %) and internships (10 %) are also common transitional activities.

(from the 2015 panel)

The most popular degree programs

The most popular degree programs

The most popular degree programs among those eligible to study in 2018 are economics (12 %), teacher training courses (11 %) and mathematics/computer science (6 %). There has been little change in the ranking of subject choices over the last ten years.

However, a significant decline can be observed regarding the uptake of mechanical engineering (2008: 9 %, 2015: 8 % vs. 2018: 5 %) and economics (2015: 14 % vs. 2018: 12 %), whereas the proportion of teacher training courses (2008: 9 %, 2015: 8 % vs. 2018: 11 %) has risen significantly.

While women are more likely to study teacher training courses (13 % vs. 7 % of men), medicine (6 % vs. 2 %) or cultural studies and linguistics (4 % vs. 2 %), men are significantly more likely to opt for technical or scientific courses: mechanical engineering (10 % vs. 3 % of women), mathematics/computer science (12 % vs. 3 %) and electrical engineering (4 % vs. <0.5 %). Business studies are also pursued slightly more frequently by men than by women (13 % vs. 10 %).

(Survey of the 2018 cohort of students)

Vocational training as an alternative to studying

Vocational training as an alternative to studying

Acquiring a higher education entrance qualification opens the doors to higher education for graduates. However, 24 % of graduates opt for vocational training as an attractive alternative to university studies. Of those with higher education entrance qualifications in 2018, 17 % had taken up vocational training six months after gaining their higher education entrance qualification; a further 6 % are firmly planning to take up vocational training in the future.

At 24 %, the gross vocational training rate for those eligible to study in 2018 is similar to that of the previous cohorts surveyed (2012: 24 %, 2010: 23 %). When looking at the different types of vocational training, the largest share is accounted for by company-based training in the dual system (15 %). Five percent of respondents have taken up school-based training or are definitely planning to do so in the future. Four percent of those surveyed chose civil servant training.

(from the 2018 panel)

The parents' level of education plays an important role

The parents' level of education plays an important role

The parents' level of education plays an important role Graduates who come from an academic background are more likely to consider a degree than pupils whose parents are not academics. 74 % of respondents who have at least one parent with an academic background would like to complete a degree exclusively. Three percent would like to complete both a degree course and vocational training, while 15 % would like to complete vocational training exclusively.

In contrast, graduates without an academic background are less likely to opt exclusively for a degree (61 %) and 27 % are more likely to opt exclusively for vocational training. As with graduates from an academic background, three percent of graduates without an academic background want to complete both vocational training and a degree course.

(Survey of the 2018 cohort of students)

Our results in the press

  • 14.05.2025 Die Zeit

    Because they don't know what they want

    10.000 ways to make the wrong decision: Many high school graduates struggle with what to do after school. But is that really a bad thing?

    Read article (in German)

View all articles

FAQ – Frequently Asked Questions

When can I expect a school-specific evaluation?

The first survey of each graduating class is carried out in writing by post to around 1,000 school branches nationwide. This requires a great deal of logistical effort, not only in sending out the questionnaires, but also in preparing the data (coding open responses, data plausibility checks and data entry). The data set is completed approximately one year after the survey. After that, the school-specific evaluations can begin, which are completed around 15 to 18 months after the survey.

Is it possible to see the results of the survey?

The results can be found in publications of the DZHW, in presentations, journal articles and monographs. Selected results from the surveys can be found on the results page.

How do I get access to the datasets as a researcher?

The Student Life Cycle Panel makes the survey data available in anonymised Scientific Use Files for scientific research purposes in the Research Data Centre (FDZ) of the DZHW. The access conditions can be found at the website of the FDZ.

View all FAQs

Contact

If you have any questions about our results, need publication copies or other documents, we will be happy to help you. Please send us a message to the following e-mail address with your request and contact details: